Blog

“Does it Matter When Booms and Busts Happen?”
For my grandparents it was the Great Depression and then an economic boom from the second World War. For my parents it was the savings and loan crisis and the subsequent tech growth and dot-com bubble. For me it has been the financial crisis of 2008 and the subsequent 11 years of growth we have now experienced. The reality is that economic booms and busts have happened a lot throughout US (and global) history and will continue to happen. While not panicking and staying the course during these times is the most advisable position, there is also a phenomenon called the “sequence of returns” that should be understood because it does play a part in an individual’s portfolio. What is Sequence of Return Risk? Sequence risk, or sequence of returns risk, analyzes the order in which your investment returns occur and highlights that poor returns in the beginning years of retirement (when you have also begun withdrawing funds from your portfolio) are more detrimental to your success than if those poor returns happened later in retirement. The best way to illustrate this is with an example. Let’s look between the years 2000 to 2014 and suppose someone retired with $1 Million invested in the stock market in the year 2000 and began pulling $40,000 per year for their living expenses. As you may know, 2000 to 2002 was not a stellar time for US stocks due to the dot-com bubble burst and 2008 was horrible with the global financial crisis. However, what if we took the returns from 2000 to 2002 and swapped them to be at the end of our analysis which is 2012 to 2014? Would that influence the results? The answer, as it turns out, is astounding. Instead of an ending portfolio balance of $273,438.15 in 2014 we would have an ending balance of $890,871.27 if we swapped the sequence of returns around! See the image below: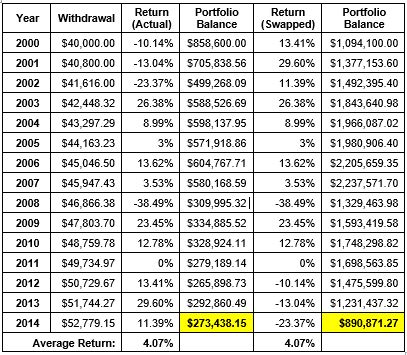 What Can I Do About It?
The results are quite dramatic, but what can we do about this sequence of returns risk? While you are never completely free of risk in a portfolio that is invested in stocks and bonds, you can make sound allocation decisions as you approach retirement that attempt to soften the impact of wild swings in the stock market. For example, someone in their 20’s and 30’s is well suited to be in a portfolio of 80% or 90% stocks (assuming they have a risk appetite that matches) because they have the benefit of time to smooth out those crazy stock market swings. However, someone in their 60’s may begin to shift their investments closer to a 50% or 60% weighting in stocks to soften the sequence of return risk we see in the table above.
The reality is that we all lead busy lives and it is tough to keep track of your investments and retirement on top of everything else on your plate. If you, or someone you know, want help in figuring out the right portfolio allocation based on your risk appetite then reach out to us today!
What Can I Do About It?
The results are quite dramatic, but what can we do about this sequence of returns risk? While you are never completely free of risk in a portfolio that is invested in stocks and bonds, you can make sound allocation decisions as you approach retirement that attempt to soften the impact of wild swings in the stock market. For example, someone in their 20’s and 30’s is well suited to be in a portfolio of 80% or 90% stocks (assuming they have a risk appetite that matches) because they have the benefit of time to smooth out those crazy stock market swings. However, someone in their 60’s may begin to shift their investments closer to a 50% or 60% weighting in stocks to soften the sequence of return risk we see in the table above.
The reality is that we all lead busy lives and it is tough to keep track of your investments and retirement on top of everything else on your plate. If you, or someone you know, want help in figuring out the right portfolio allocation based on your risk appetite then reach out to us today!
Copyright © 2025
Van Gelder Financial